Posts

Showing posts from April, 2015

Math Stars - for summer math and more

Image
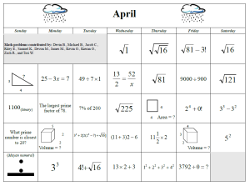
I have used Math Stars problem solving sets with my girls for several years, and they have always greatly enjoyed them. Math Stars include various puzzles and challenging math problems. They  come as PDF files (free and ready to download & use) in sets for grades 1-8. They're great to use for summer math  or for some fun problem solving at any time. I tend to use the problems from one grade level below the grade the student is in. One reason I like these so much is the variety of the problems - geometrical puzzles, number puzzles, logical thinking, etc. --  all of it is included! Another reason is that the sets go all the way from grade 1 upward. There exist actually lots of problem solving resources but not so many for the early grades. Each set per grade has 10 two-page "newsletters", and each "newsletter" has 8-10 problems. The number of stars in each problem marks the level of difficulty. Answers are included. Math Stars Problem Solving

Lessons on statistics

Image
Is statistics one of your favorite or least favorite topics in math? :) Well... however you feel about it, in middle school students need to learn some beginnings of statistics, such as how to draw a boxplot, a histogram, or a stem-and-leaf plot, learn about statistical distributions, measures of central tendency (mean, median, and mode), measures of variability, and so on. You can now do so with these videos of mine   :^)   or with this Youtube playlist . I hope they are of help!

An update on grade MM 7-B

Image
Some have asked about grade 7-B (once again...) I'm currently writing lessons for the last chapter (statistics & probability) AND writing the answer key for the second to last chapter (on the Pythagorean Theorem). And two people are proofreading the geometry chapter (in different sections). So it's coming along just fine. ;^) I'm hoping to have it ready in late May or early June. Here's an example of what I was working on just this morning - a problem for a lesson where students compare two sets of data. I made up the data, but it is based on real data from the official government site for fuel efficiency ( www.fueleconomy.gov ). I hope you enjoy this little "glimpse" into my work. :) 4. A double-bar graph is also sometimes used to show differences and similarities of two data sets. The graph below shows the fuel efficiency in miles per gallon (MPG) for a group of small and standard sports utility vehicles (SUVs). Study the graph careful

April math calendar

Image
I just printed this math calendar out for my girls and they liked it! Something a bit intriguing and fun to look at as the month progresses -- and it can help them to learn a bit of math at the same time. :)