An update on grade MM 7-B
Some have asked about grade 7-B (once again...)
I'm currently writing lessons for the last chapter (statistics & probability) AND writing the answer key for the second to last chapter (on the Pythagorean Theorem). And two people are proofreading the geometry chapter (in different sections). So it's coming along just fine. ;^) I'm hoping to have it ready in late May or early June.
Here's an example of what I was working on just this morning - a problem for a lesson where students compare two sets of data. I made up the data, but it is based on real data from the official government site for fuel efficiency (www.fueleconomy.gov).
I hope you enjoy this little "glimpse" into my work. :)
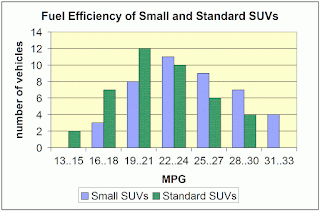
4. A double-bar graph is also sometimes used to show differences
and similarities of two data sets. The graph below shows the
fuel efficiency in miles per gallon (MPG) for a group of small
and standard sports utility vehicles (SUVs).
Study the graph carefully, and then describe the
differences and the similarities in the fuel efficiency
of the two types of cars.
I'm currently writing lessons for the last chapter (statistics & probability) AND writing the answer key for the second to last chapter (on the Pythagorean Theorem). And two people are proofreading the geometry chapter (in different sections). So it's coming along just fine. ;^) I'm hoping to have it ready in late May or early June.
Here's an example of what I was working on just this morning - a problem for a lesson where students compare two sets of data. I made up the data, but it is based on real data from the official government site for fuel efficiency (www.fueleconomy.gov).
I hope you enjoy this little "glimpse" into my work. :)
4. A double-bar graph is also sometimes used to show differences
and similarities of two data sets. The graph below shows the
fuel efficiency in miles per gallon (MPG) for a group of small
and standard sports utility vehicles (SUVs).
Study the graph carefully, and then describe the
differences and the similarities in the fuel efficiency
of the two types of cars.


Comments